Weather-Guide.com
Tokyo Weather Averages
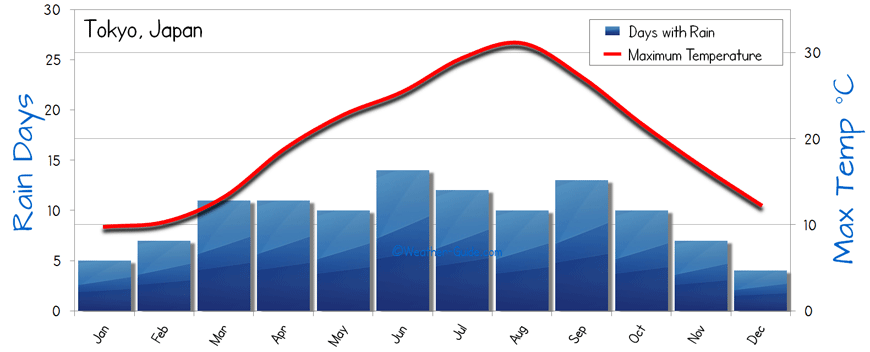
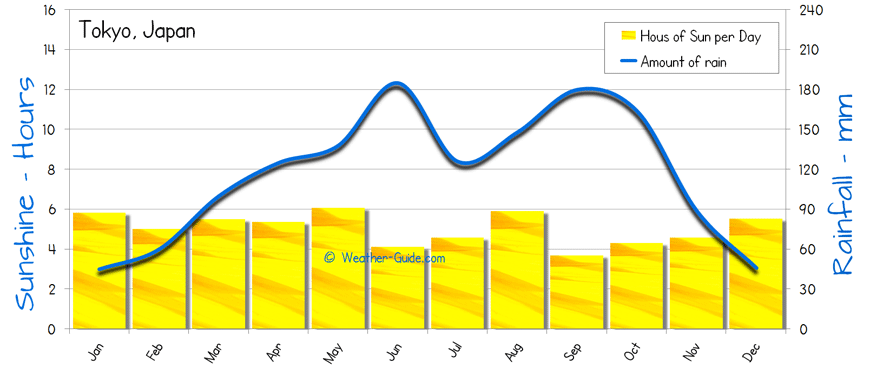
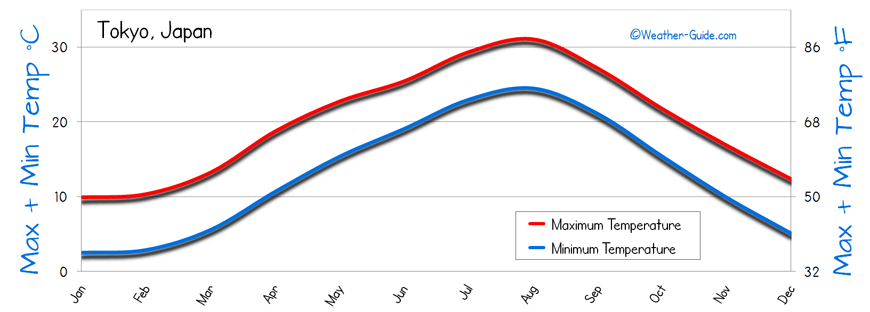
The following weather charts display the monthly average weather conditions of Tokyo, Japan. The first weather chart shows the maximum day time temperature and the number of wet days per month, the second displays the average number of hours of sunshine per day verses the monthly average rainfall and the third chart compares the maximum and minimum temperature in Fahrenheit and Centigrade. This weather data can be useful when planning a business trip, holiday or vacation to Tokyo, Japan.
The Weather of Tokyo

The above weather chart of Tokyo, Japan summarises the monthly averages and season trends.
Sunshine and Rainfall for Tokyo

The average hours of sunshine per day verses the amount of rainfall for Tokyo, Japan
The Maximum and Minimum Temperature of Tokyo

Tokyo Maximum and Minimum Temperature in centigrade and fahrenheit.
When to Visit Tokyo for a Holiday
In general the best months to visit Japan and Tokyo are either during the spring months (April to May) and the autumn months (October and November). These two tourist seasons miss the hot and oppressively humid summers and the wet and gray winters. The height of the tourist season and time of year preferred by the Japanese is the short cherry blossom season that occurs in mid spring. The worst time of year to visit Japan is at the height of summer when the high humidity can make every activity draining and difficult.
More Japan Holiday Weather
Himeji Castle - Hiroshima - Kobe - Kyoto - Miyajima - Nagoya - Nara - Osaka
More Asian City Weather
World Weather
Bangkok, Thailand - Beijing, China - Hong Kong - Jakarta, Indonesia - Kathmandu, Nepal - Koh Samui, Thailand - Kuala Lumpur, Malaysia - Macau
Manila, Philippines - Phuket, Thailand - Seoul, Korea - Shanghai, China - Singapore - Tokyo, Japan - Ulan Bator - Vientiane
Australia & NZ - Asia - Canada - China - East Europe - France - Germany - Ireland
India - Italy - Korea - Mexico - Morocco - New Zealand - Portugal - Japan
South America - Spain - Sri Lanka - Tunisia - Thailand - USA - Uk - Vietnam
Weather-Guide.com, With Over 1,000 Pages There's Too Many To List Here!